ElectoralSelect is a web app I built to help voters match with candidates, featuring a custom matching algorithm and an intuitive admin dashboard for seamless content updates.
Political Candidate Compatibility Web App
This is a personal project that I called ElectoralSelect — a web-based app that helps prospective voters identify the political candidates that best match their beliefs. This project was endeavor in understanding and developing algorithms and how to successfully implement them into a working web application connected to an admin dashboard that would allow a client to easily and intuitively update the information.
- Successful development of candidate matching algorithm
- Customizable algorithm settings for calculation adjustments
- Fully responsive web app
Steve did an amazing job with putting this project together. We low-key had a competition going in which we had Steve and a team of developers race towards building a working matching web-app, and not only did he do in 10 days what took the other team 9 months, but his build featured a superior, cleaner UI and a more sophisticated algorithm. He really blew us all out of the water with what he did and how quickly he did it!

If you search around the internet, you’ll notice that there isn’t any shortage of websites aimed towards helping prospective voters identify which political candidates best match their personal and political beliefs. This project was taken on as a rigorous and highly formative endeavor to sharpen my skills in web development, user experience design, algorithm development, and project management.
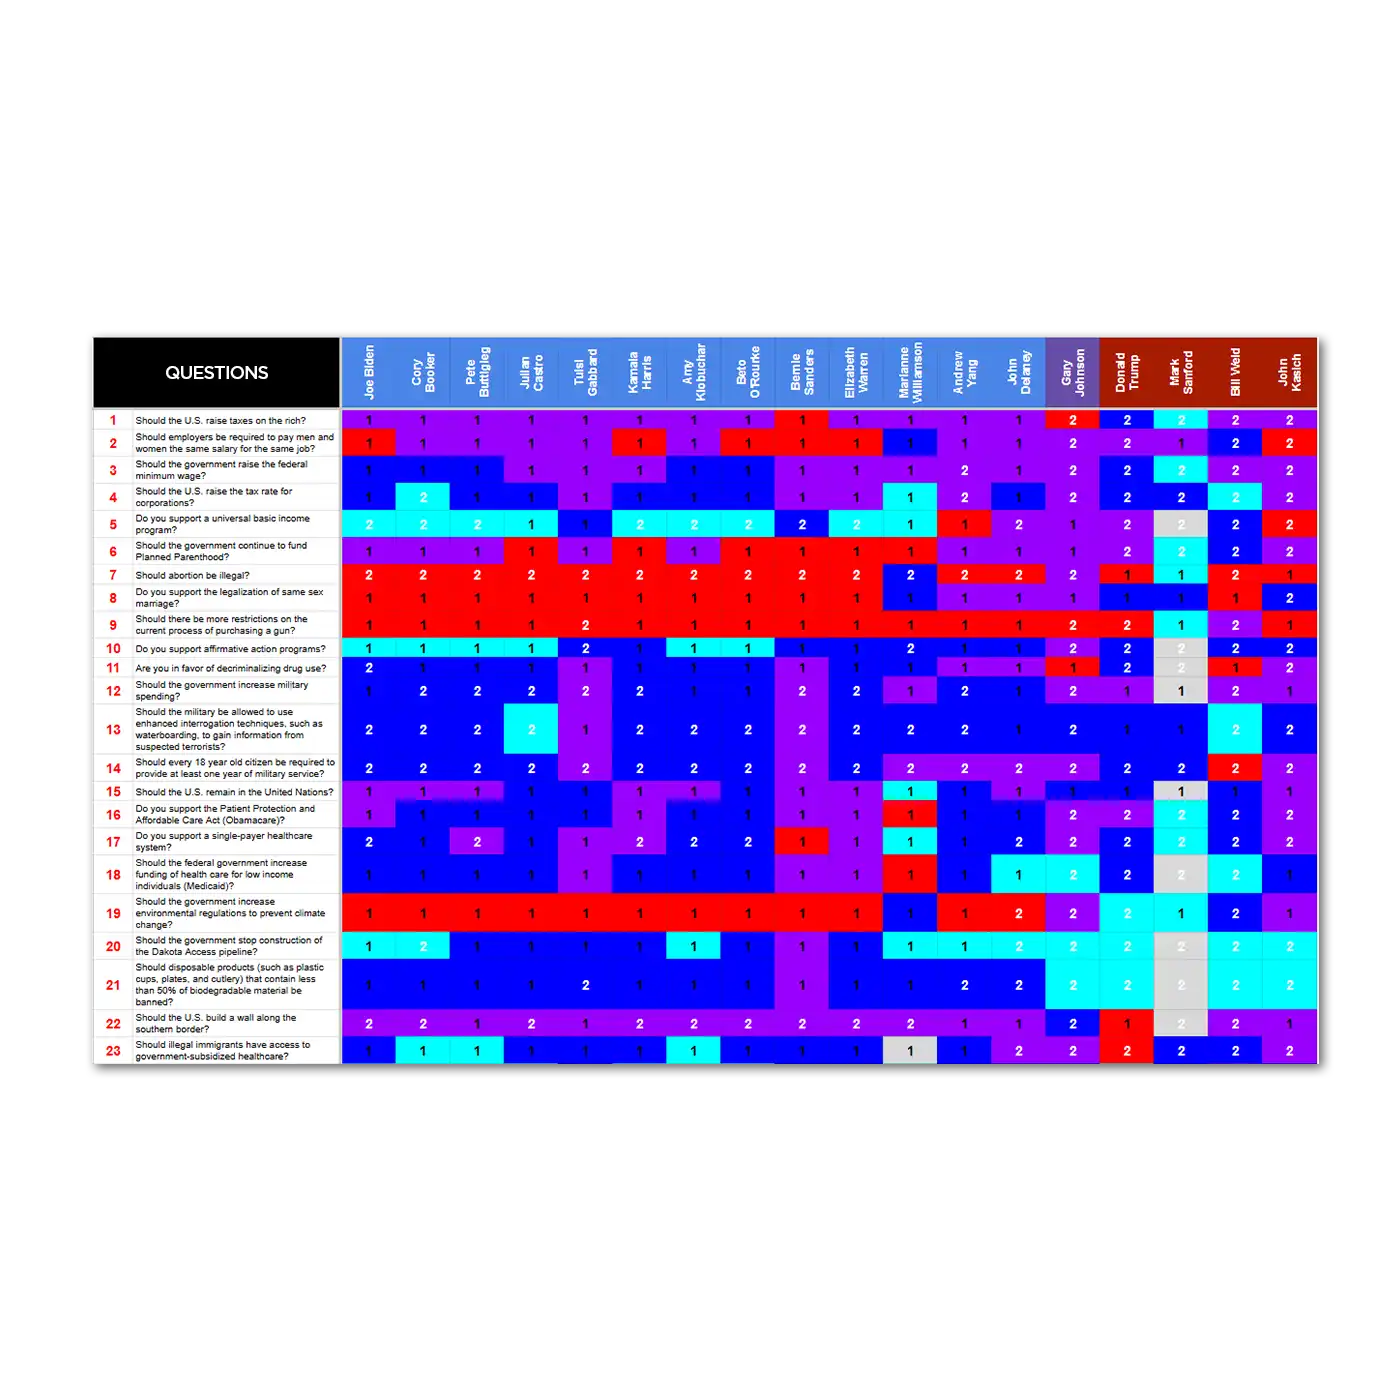
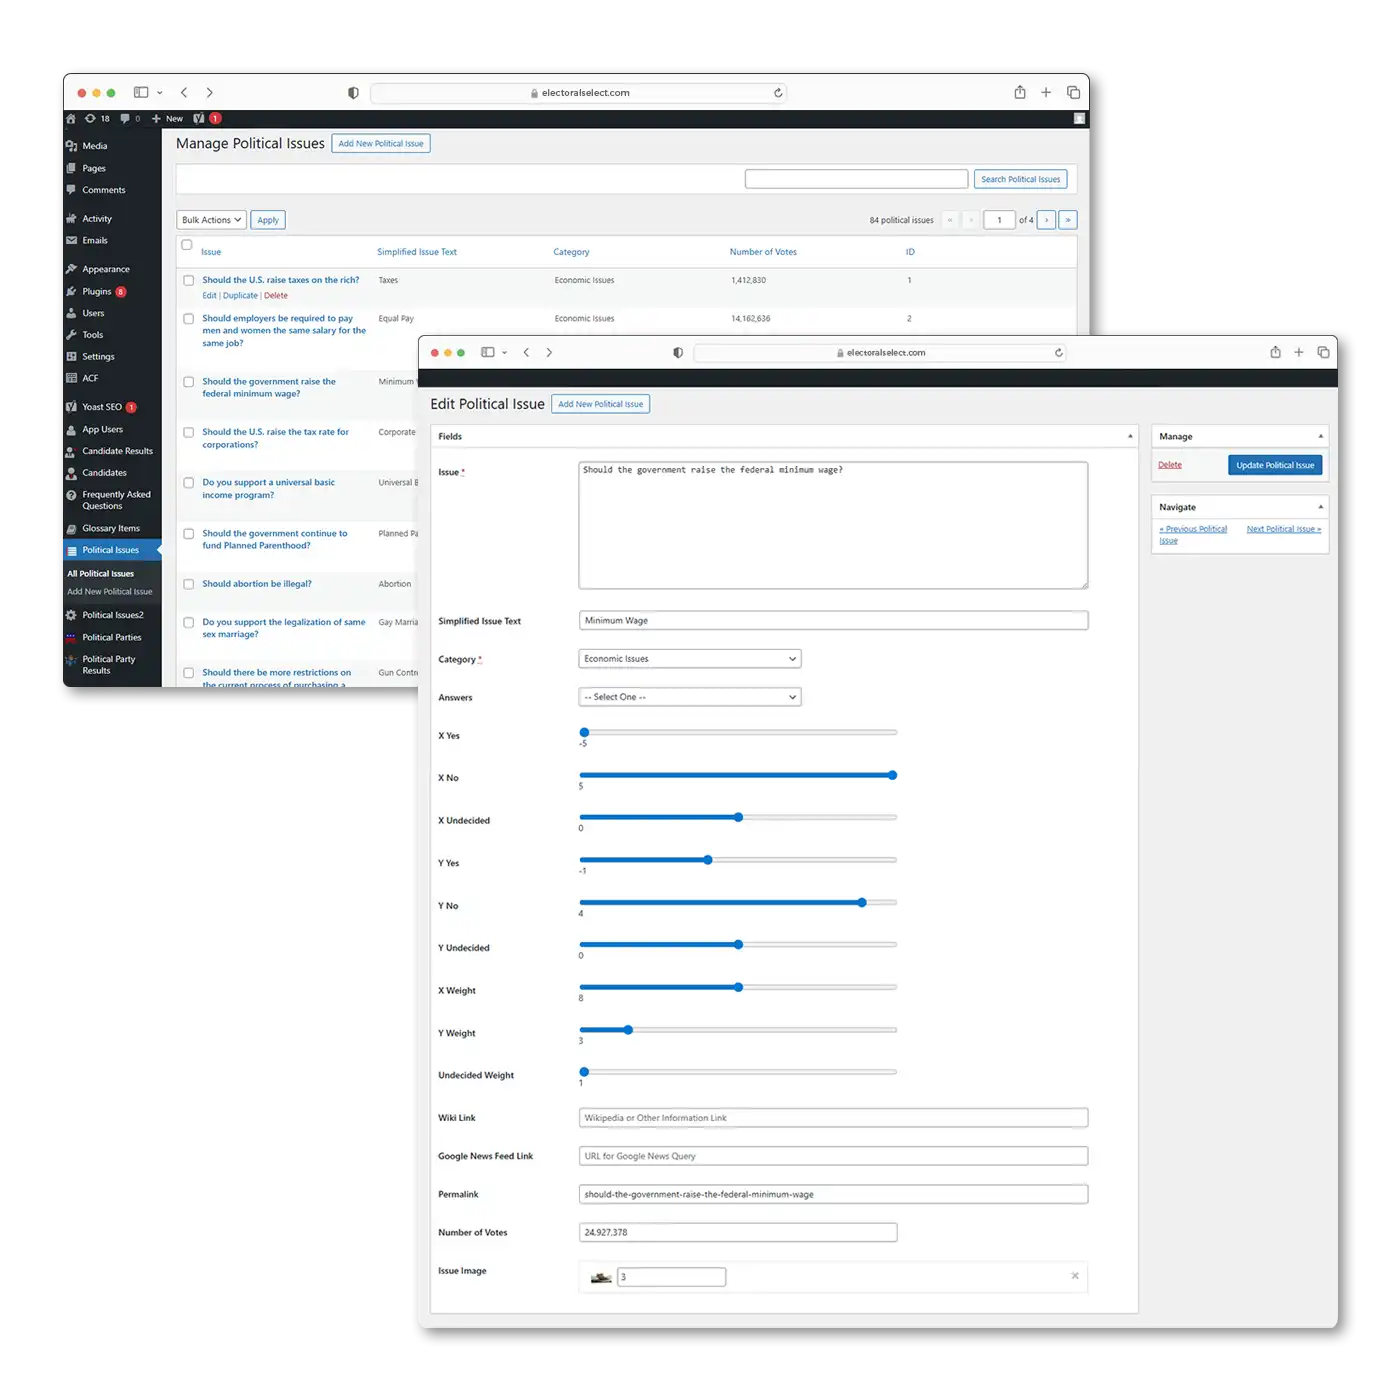
As part of the challenge, I had to procure my own political science data — arguably the MOST important part of this project. Without a reliable data set, our matching system would become largely nonsense. Without access to a proper political science expert or professional, I did something I don’t condone — I borrowed the candidate data available on isidewith.com — a non-partisan, non-profit group that already does what we’re asking. From that site, you can freely access a battery of questions, how candidates answered, and how important that issue is to each respective candidate. Once I organized all of the collected information into a spreadsheet, I had a solid jumping-off point for developing the match algorithm.
In order to understand the data, I needed a way to visualize the aggregate data points to classify them and then compare them to a single user data point. The obvious solution is to create a 2-axis grid of political tendencies and then plot aggregate candidate data as a scatterplot. The x-axis would be left-wing/right-wing, and the y-axis would be libertarianism versus authoritarianism. Starting the center point as [0,0], we can move left or down by subtracting, and right or up by adding. In designing the module that handles the quiz input, I incorporated a weight system for each question that increases the value of an answer based on the importance to a candidate or user. Ultimately, the answers are averaged and then positioned on the plot. The user point is then compared against each of the candidates and a function is executed to calculate the closest matching candidates and return the top closest matches.
For the front-end side, the compatibility quiz element was designed to closely resemble an actual voting ballot. The questions are grouped by category and each question can have additional (issue) information, as assigned in the back-end administrative module, to offer users the option to learn more before committing their answer. On the back-end of the quiz module, each question can be assigned a category, information links, and has sliders to determine how each respective answer affects scatterplot positioning.
Once I completed inputting all of the questions and constructed a functioning web app, I had to verify that the algorithm was working as expected. So, I ran tests using data sets that I knew where the final data point would be — which was the answers and weights of the candidates in the data that I collected. By completing test quizzes and observing the resulting scatterplot coordinates, I was able to make minor tweaks in the quiz module to adjust the weights of certain questions in order to verify that the algorithm was correctly aligned.
This project gave me tremendous insight into building a complex app requiring a rigorously designed algorithm. My greatest success in this project was having spent a large amount of time during the early stages strategically planning contingencies for variables in the calculations of the algorithm — which ended up being the exact things that allowed me to fine-tune the computational alignments so that the data output matched the expectations from the mathematical models acquired during my research. Oftentimes in business situations, the strategic planning phase is overlooked or undervalued — but here, dedicated time to build a deep understanding of the project requirements and the freedom to develop the foresight to address potential problems was absolutely vital to delivering a high-quality solution at a lightning pace.